Diving into the Fear and Greed Index
In the world of crypto, charts, candles, and trend lines often dominate the conversation. We obsess over Moving Averages, RSI, and MACD, looking for the perfect technical signal to enter or exit a trade.
But there is an invisible hand moving the market that is far more powerful than any support line: human emotion.
Crypto markets are notoriously volatile, they are driven by psychological triggers. When the market shoots up, investors experience FOMO (Fear Of Missing Out) and greed. When the market tanks, they react with irrational panic and fear.
Enter the Crypto Fear and Greed Index.
This metric has become one of the most cited indicators in the industry, serving as a compass for navigating the emotional storms of Bitcoin and altcoins.
But what exactly is it? How is it calculated? And most importantly, if you had followed its signals blindly over the past few years, would you be rich or broke?
Let’s tear down the mechanics of the Fear and Greed Index, analyze its historical reliability, and discuss how you can use it to time your buys and sells.
Anatomy of the Fear and Greed
To understand the index, we must first understand the problem it solves. Traditional financial markets have long used sentiment indicators (like the VIX or the CNN Money Fear and Greed Index) to gauge whether stocks are overbought or oversold.
The crypto version, developed primarily by Alternative.me, adapts this concept for the blockchain asset class.
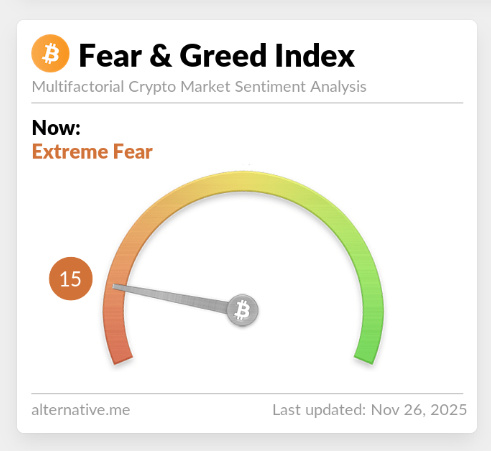
The index outputs a single number from 0 to 100.
- 0 to 24: Extreme Fear (Orange/Red) – Investors are panicking. This is often a sign that the market is oversold.
- 25 to 49: Fear (Yellow/Amber) – Investors are cautious and bearish.
- 50: Neutral – No distinct sentiment dominates.
- 51 to 74: Greed (Light Green) – Investors are buying, and confidence is high.
- 75 to 100: Extreme Greed (Green) – FOMO is rampant. The market may be due for a correction.
Under the Hood: The 6 Data Sources
The index isn’t just a random survey of Twitter users; it is an algorithmic aggregate of roughly five to six distinct data points. Understanding these inputs is crucial because it helps you realize why the index is moving.
1. Volatility (25%) Volatility is the biggest heavyweight in the algorithm. The index compares the current volatility and maximum drawdowns of Bitcoin against the average values of the last 30 and 90 days.
- The Logic: An unusual rise in volatility is usually a sign of a fearful market. In crypto, “volatility” is often synonymous with “crashing” in the public eye, even though upside volatility exists. When price swings become violent and unpredictable, the index ticks down toward Fear.
2. Market Momentum/Volume (25%) This component measures the current volume and market momentum, again comparing it to the last 30/90-day averages.
- The Logic: When we see high buying volumes on a daily basis in a positive market, the index concludes that the market is becoming overly greedy/bullish. Conversely, low volume during a drop confirms apathy or fear.
3. Social Media (15%) The algorithm scrapes data from social media platforms (primarily X/Twitter and Reddit) tracking hashtags and keywords related to Bitcoin and major alts. It analyzes the speed and number of interactions.
- The Logic: An unusually high interaction rate often corresponds to a greedy market (the “hype” phase). When the timeline goes quiet, or the sentiment analysis detects panic keywords, it shifts toward Fear.
4. Dominance (10%) This measures Bitcoin’s dominance relative to the rest of the crypto market cap.
- The Logic: This is a clever inclusion. In the crypto world, Bitcoin is viewed as the “safe haven.” When Bitcoin dominance rises, it usually means investors are fleeing speculative altcoins and retreating to the safety of BTC (Fear). When Bitcoin dominance drops, it means investors are getting “greedy” enough to gamble on smaller, riskier altcoins (Greed).
5. Trends (10%) This pulls data from Google Trends for various Bitcoin-related search queries. It looks not just at volume, but the type of queries.
- The Logic: If searches for “Bitcoin price drop” or “Bitcoin manipulation” spike, it indicates fear. If searches for “How to buy Bitcoin” or “Moon prediction” spike, it indicates greed.
6. Surveys (15%) Note: This portion is currently paused by Alternative.me, but historically played a role. The platform used to conduct weekly crypto polls to gauge the direct sentiment of the community. While currently paused, it’s worth noting that direct investor sentiment was part of the original thesis.
The Theory of Contrarian Investing
The core philosophy behind using the Fear and Greed Index is Contrarian Investing.
Warren Buffett famously said: “Be fearful when others are greedy, and greedy when others are fearful.”
In the context of the Fear and Greed Index, the strategy is simple:
- Buy when the index is in Extreme Fear (0-20).
- Sell when the index is in Extreme Greed (80-100).
The assumption is that the crowd is usually wrong at the extremes.
When the index hits Extreme Greed, “dumb money” is piling in at the top, driven by FOMO. This is historically when whales (smart money) begin to distribute (sell) their coins.
When the index hits Extreme Fear, “dumb money” is panic selling at a loss. This is when whales accumulate assets at a discount.
But does this theory hold up against the cold, hard data of the last few cycles?
Historical Analysis (Does it actually work?)
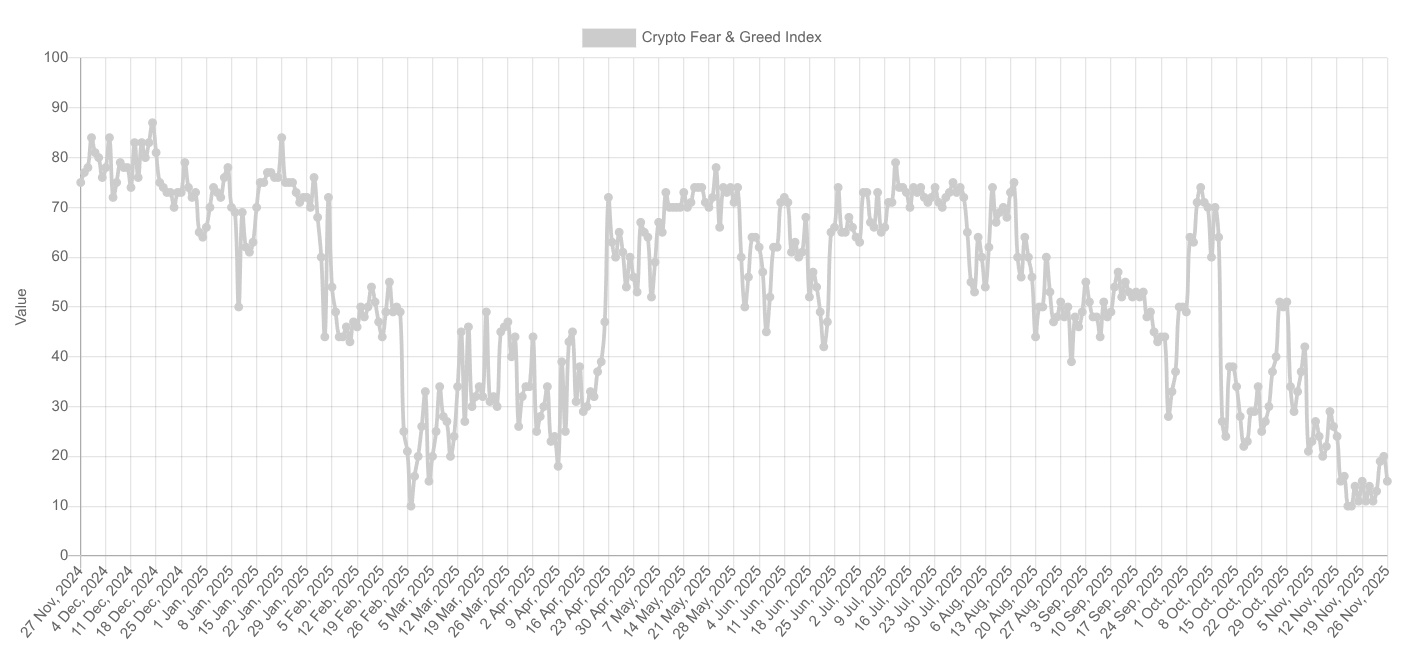
Let’s travel back through time and layer the Fear and Greed Index over the Bitcoin price chart to see how a sentiment-based trader would have fared.
The 2018 Bear Market Bottom
- Scenario: After the 2017 high of $20,000, Bitcoin spent 2018 bleeding out. By December 2018, BTC had dropped to $3,200.
- The Index: During November and December 2018, the index consistently flashed Extreme Fear, dropping as low as roughly 10.
- The Result: If you had bought when the index hit single digits in late 2018, you would have bought the exact bottom of the cycle. This was a perfect signal.
The March 2020 “Black Swan” (Covid Crash)
- Scenario: Global markets collapsed due to the pandemic. Bitcoin plummeted from $8,000 to $3,800 in roughly 48 hours.
- The Index: The index dropped to 8—one of the lowest readings in history. The sentiment was apocalyptic. Twitter was convinced Bitcoin was going to zero.
- The Result: This was arguably the greatest buying opportunity of the decade. Buying at an index of 8 yielded a 15x return over the next year as Bitcoin rallied to $60,000.
- Verdict: Strong Buy Signal validated.
The 2021 Bull Run (The Flaw of “Selling Greed”)
Here is where the strategy gets tricky.
- Scenario: From late 2020 to April 2021, Bitcoin was in a parabolic bull run.
- The Index: The index entered Extreme Greed (>75) in November 2020 (when BTC was around $18k) and stayed there for months. It hovered between 80 and 95 for weeks on end.
- The Result: If you had sold the moment the index hit “Extreme Greed” (say, at $19,000 or $25,000), you would have missed the run to $64,000.
- The Lesson: Greed can persist. In a strong bull market, the index can stay “pegged” at high greed levels while the price continues to double or triple. While “Extreme Fear” is usually a sharp, short-lived V-shape recovery, “Extreme Greed” can be a long, rounded plateau.
The November 2021 Double Top (Divergence)
- Scenario: After crashing in May, Bitcoin rallied back to a new All-Time High of $69,000 in November 2021.
- The Index: Interestingly, while the price made a new high, the Fear and Greed Index did not reach the same highs it saw in early 2021. It peaked around 84, whereas in Feb 2021 it hit 95.
- The Result: This was a bearish divergence. The crowd was excited, but not as euphoric as before, signaling exhaustion. Selling here was the right move, as the market entered a brutal bear cycle shortly after.
The 2022 FTX Collapse
- Scenario: In November 2022, FTX collapsed, and Bitcoin dropped to $15,500.
- The Index: The index flashed Extreme Fear (around 20). However, it had been lingering in fear for months (since the Terra Luna crash in May).
- The Result: While buying the “Luna Crash” fear (May 2022) would have put you underwater for a while, buying the “FTX Crash” fear (Nov 2022) was the absolute bottom of the cycle.
- Verdict: Buying fear requires patience. You might buy early (catching a falling knife), but if you have a long time horizon, buying extreme fear in 2022 guaranteed an entry price of $16k-$20k, which has since doubled or tripled.
Data-Driven Strategies (Backtesting)
It’s one thing to look at charts in hindsight; it’s another to run a mathematical simulation. Several analysts and quants have backtested the Fear and Greed strategy against a simple “Buy and Hold” (HODL) strategy.
1. The “Buy Fear, Sell Greed” Strategy
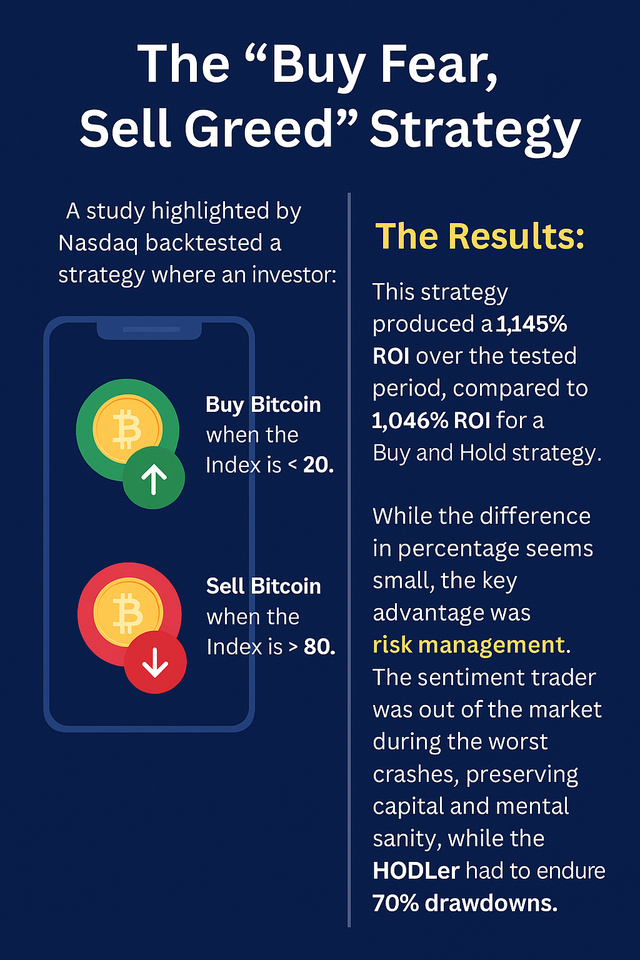
A study highlighted by Nasdaq backtested a strategy where an investor:
- Buys Bitcoin when the Index is < 20.
- Sells Bitcoin when the Index is > 80.
The Results:
This strategy produced a 1,145% ROI over the tested period, compared to 1,046% ROI for a Buy and Hold strategy. While the difference in percentage seems small, the key advantage was risk management. The sentiment trader was out of the market during the worst crashes, preserving capital and mental sanity, while the HODLer had to endure 70% drawdowns.
2. The DCA (Dollar Cost Average) Adjustment Strategy
A more practical strategy for most investors is not to sell everything, but to adjust their buying pressure. A popular backtest shared on crypto forums (and verified by Cointelegraph contributors) tested a “Tiered DCA” approach:
- Extreme Fear (0-25): Buy $150/week.
- Fear (26-49): Buy $100/week.
- Neutral (50): Buy $75/week.
- Greed (51-75): Buy $50/week.
- Extreme Greed (76-100): Buy $25/week (or Sell small percentage).
The Results:
This “Dynamic DCA” significantly outperformed standard DCA. By aggressively deploying cash when the world was ending (Fear) and tightening the purse strings when the world was euphoric (Greed), investors lowered their average cost basis drastically.
One specific variation of this strategy—which involved selling 5% of holdings each week the index was in Extreme Greed—yielded an 184% ROI against a benchmark of 124%.
The Nuances and Risks
Before you go creating a trading bot that executes trades based solely on this index, you need to understand its limitations.
1. It is a Lagging Indicator
The Fear and Greed Index relies on data that has already happened (past volatility, past volume, past search trends). It reacts to price; it does not predict it. It tells you “the market is scared right now,” not “the market will bounce tomorrow.”
2. The “Super-Cycle” Trap
As mentioned in the 2021 analysis, during a massive adoption wave (like the ETF approvals or a halving run), the market can remain “irrationally exuberant” for a long time. If you sell the moment the index hits 80, you might sell Bitcoin at $70,000 only to watch it go to $100,000.
- The Fix: Use the index as a warning sign, not a hard exit signal. When it hits 80, don’t sell everything. Instead, tighten your stop-losses, stop buying, or take small profits (skim the top).
3. Diminishing Returns of Fear
In a relentless bear market (like 2022), the index can stay in “Extreme Fear” for 6 months. If you go “All In” the first time it hits 20, you might run out of cash while the market drops another 50%.
- The Fix: When in Extreme Fear, DCA (Dollar Cost Average) slowly. Don’t blow your entire stack on the first red day.
Conclusion: How to Use It Today
The Crypto Fear and Greed Index is one of the few tools that forces you to act against your instincts. Biologically, we are wired to run from danger (selling during crashes) and gather with the herd (buying during pumps). This index provides the objective data needed to override those biological errors.
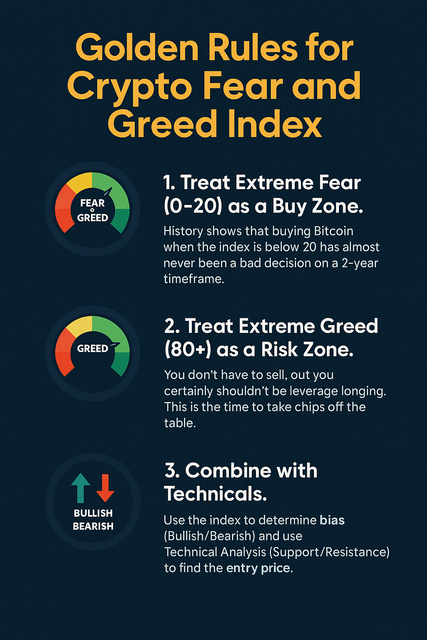
The Golden Rules for using the Index:
- Treat Extreme Fear (0-20) as a Buy Zone. History shows that buying Bitcoin when the index is below 20 has almost never been a bad decision on a 2-year timeframe.
- Treat Extreme Greed (80+) as a Risk Zone. You don’t have to sell, but you certainly shouldn’t be leverage longing. This is the time to take chips off the table.
- Combine with Technicals. Use the index to determine bias (Bullish/Bearish) and use Technical Analysis (Support/Resistance) to find the entry price.
The market is an emotional beast. The Fear and Greed Index is the mirror that reveals its mood. If you can learn to read the mirror, you can stop being a victim of the market’s mood swings and start profiting from them.